Maximising Impact: Insights and Global Reach of the GDB
The Global Data Barometer (GDB) has played a crucial role in providing globally comparable evidence to support national and global decision-making related to data for development strategies. Since its launch 18 months ago, its data has been instrumental in fostering new products and enhancing the work of various stakeholders across multiple sectors.
In the face of a new edition, we have explored the numerous uses, mentions, and knowledge generated after the release of the first edition’s results. This analysis, conducted by Ricardo Meneses with the D4D Network’s support, is aimed at enriching future editions of the GDB.
Geographical Reach
In terms of geographical reach, the Barometer has made an impact in at least 42 countries with 115 mentions and applications, particularly in the United States, Ukraine, Colombia, the United Kingdom, and Hong Kong. Its significance in global policy discussions has also been recognized by international entities. For example, the Open Government Partnership Broken Links Report and the Open Contracting Partnership resource on fulfilling e-procurement reforms. Notably, the majority of GDB-related content was in English (71%), with Spanish following.

Figure 1. Language: Percent of uses and mentions according to language
Key Users
Civil Society Organizations (CSOs) have been at the forefront, accounting for 55% of the coverage, highlighting their crucial role in disseminating GDB insights. The press and academia, with 22% and 12% contributions respectively, also underscore the Barometer’s extensive influence across different sectors.
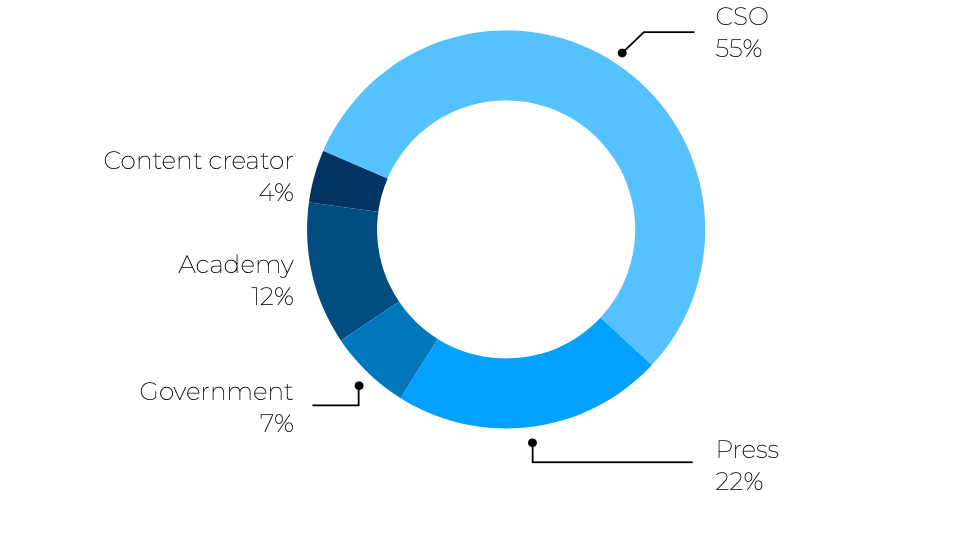
Figure 2. Type of Source: Percentage of uses and mentions according to their user group
Formats of Engagement
In terms of engagement formats, discussions predominantly occurred in news and blog posts, alongside reports (22%) and multimedia content (12%). This variety facilitated dynamic dialogues and catered to diverse audiences.
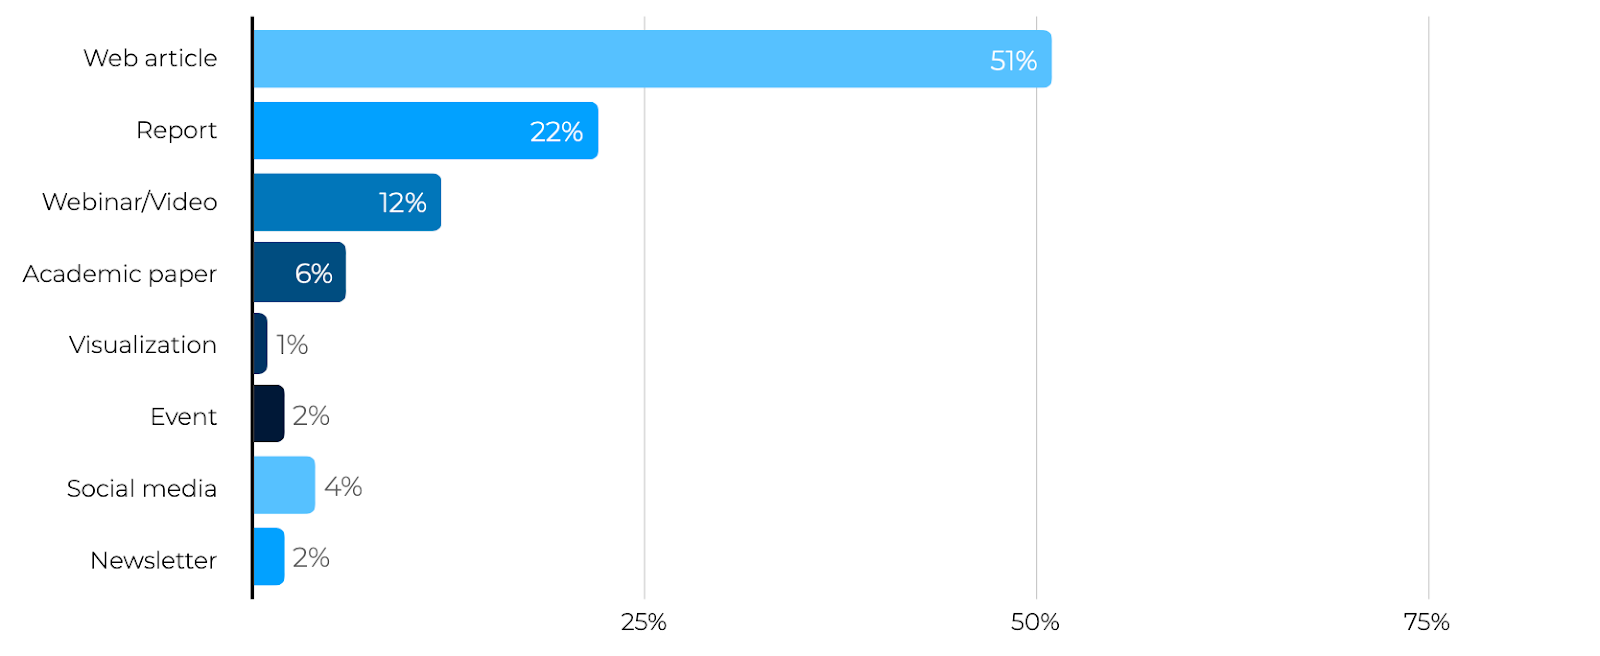
Figure 3. Format: Percentage of uses and mentions according to their format
Content Creation
CSOs showed versatility in their publication methods, using digital articles, social media, events, and new reports. This approach reflects the GDB’s multifaceted engagement across various mediums.
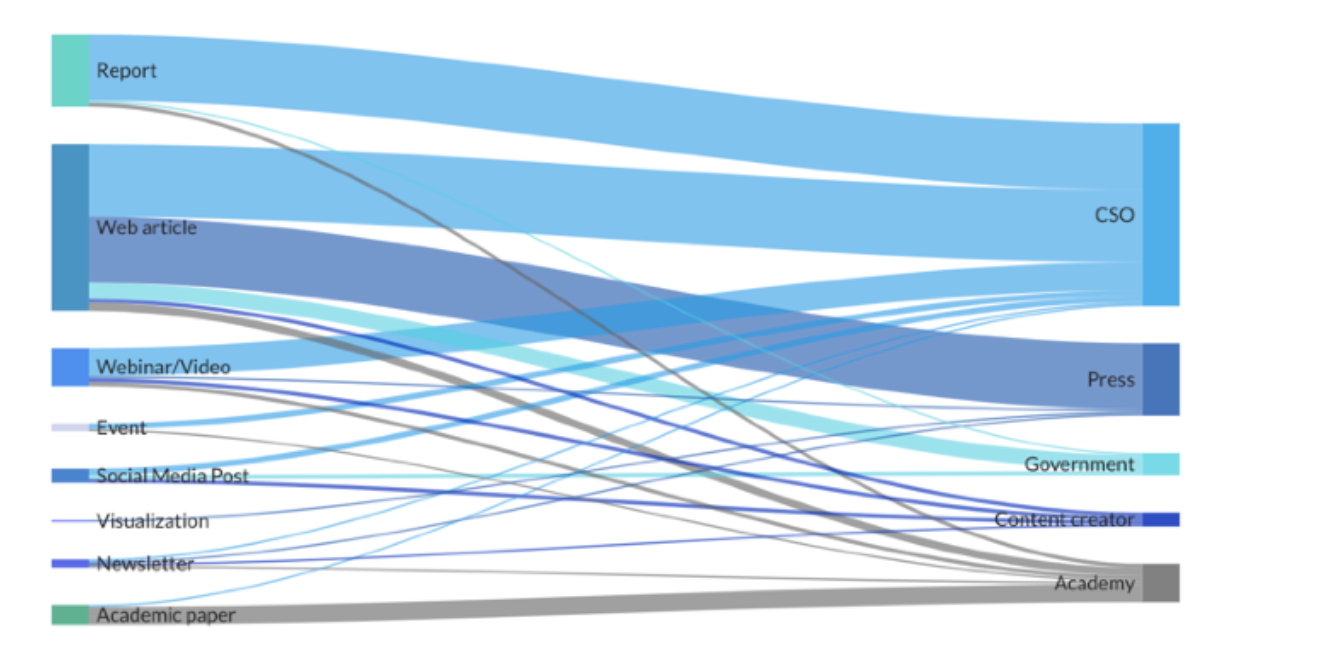
Figure 4. Format and source: Amount of mentions and uses by format and reach
Timeline and Impact
Since its release in May 2022, the GDB has maintained a consistent presence in monthly reports, with a peak in media attention in October 2023. This consistent presence highlights its ongoing relevance.
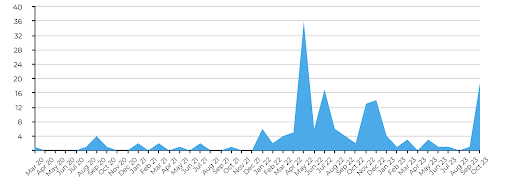
Figure 5. Timeline: Number of mentions and uses between 2020 and 2023
Reach and Effectiveness
Potential reach and daily reach metrics were crucial in assessing the GDB’s impact. Media outlets had a higher aggregate potential reach, while academic publications showed greater daily engagement. The GDB’s influence was categorised into mentions (simple citations) and uses (integrating GDB data into new content). The GDB’s influence was observed in both mentions and uses, with CSOs contributing significantly (74%) to the latter.
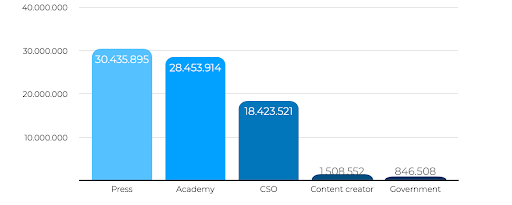
Figure 6. Potential reach: Total organic traffic (potential reach) by type of source
The inaugural edition of the GDB has thus laid a foundational stone for future discussions in 109 countries globally, focusing on the use of data for the public good. It represents a benchmark for harnessing data in ways that benefit society, guided by collaborative efforts and strategic partnerships. However, there is still considerable potential to expand and fortify the use of data generated by the GDB. In the coming weeks, we will share blog posts detailing support provided in the Global South through the GDB mini-grants program, aiming to enhance the impact and usefulness of GDB data.
Stay tuned!
