
Examining Political Party Financial Transparency Worldwide with R
Welcome back to the Global Data Barometer Use series! In this installment, we’re delving into the field of political integrity, examining two key indicators from one of the Barometer’s modules, co-developed with Transparency International and the Open Government Partnership (OGP). These indicators shed light on the intricate world of political finance, a critical aspect of modern democracies.
The first indicator, ‘Governance: Political finance’, examines existing frameworks that require political parties and political campaigns to divulge information about how they raise and spend money. The second indicator, ‘Availability: Political finance data’, assesses the extent to which political finance data is available as open data. Together, these indicators offer crucial insights into the financing and spending dynamics of political parties.
But why is this data crucial? As emphasized in the OGP Broken Links Report, political finance significantly shapes democratic processes, as elections and political competitions are inherently resource-intensive endeavors. Transparency and open data policies are indispensable safeguards against clandestine financial contributions to political actors, which could unduly influence policy decisions. Moreover, transparent disclosure of political party financing fosters accountability and aids in the fight against corruption.
In this blogpost, we aim to provide insights into the legal and regulatory frameworks that can elevate data publication standards, ensuring data use, and promoting cooperation. And how do we plan to achieve this? By posing pertinent questions that help identify countries with robust regulations governing political party financing and varying levels of data openness.
Analyzing the Global Political Finance Landscape with R
To facilitate this analysis, we’ll be utilizing R, a statistical and data visualization software. Our objective is to empower individuals with beginner skills to navigate through the questions, load necessary data libraries, and derive meaningful insights, mirroring our own analysis. Let’s dig in!
The first question seeks to understand the extent to which laws, regulations, and policies facilitate the collection and publication of campaign and party finance data. Conversely, the second question examines the accessibility and availability of political finance information in open data format. Through a comprehensive scoring system, ranging from 0 to 1, we evaluate various factors contributing to the overall assessment.
Before you roll your sleeves, here’s a little disclaimer, this is going to be a long one bestie so brace yourself! 🙂
To kick start the process, the initial step involves downloading the political integrity dataset from the Global Data Barometer website. Once you have downloaded the dataset, you can open R on your computer or you can use this Posit Cloud’s repository and run the code. After opening R or posit cloud we can load the necessary libraries and the dataset as highlighted below:
If you don’t have the packages installed, uncomment the next line and install them!
#install.packages(c(“tidyverse”, “cluster”, “sf”, “factoextra”, “flextable”))

library(tidyverse)

library(cluster)

library(sf)

library(factoextra)

library(flextable)

original_colors <- c("#5dcbca", "#3ab2b1", "#249c9b", "#168988", "#0e7877", "#096968")

palette_10 <- colorRampPalette(original_colors)(10)

gdb_2021_full_dataset <- read_csv("https://storage.googleapis.com/gdb-files/modules/gdb-2021-political-integrity-module-data.csv")
Unveiling Country-Specific Insights: Scores and Trends
gdb_filter<- gdb_2021_full_dataset %>%

filter(!is.na(score)) %>%

filter(question %in% c("To what extent do relevant laws, regulations, policies, and guidance provide a basis for collecting and publishing data on campaign and party finance?","To what extent is political finance information available as open data?")) %>%

select(country, indicator_name,score) %>%

spread(indicator_name,score)  %>%

rename(availability_score="Availability (PI): Political finance data",

governance_score="Governance (PI): Political finance"

)flextable(head(gdb_filter,5))
| Country | availability_score | governance_score |
|---|---|---|
| Albania | 0.000 | 60.0000 |
| Angola | 0.000 | 15.0600 |
| Argentina | 80.763 | 91.0575 |
| Armenia | 48.036 | 82.3650 |
| Australia | 59.600 | 70.3950 |
country_ = "Australia"

score1 = gdb_filter[gdb_filter$country == country_, "availability_score"]

score2 = gdb_filter[gdb_filter$country == country_, "governance_score"]

print(paste("In", country_, "the score for availability of finance data of political parties is", round(score1,1), "and the governance score is",  round(score2,1), "."))

[1] "In Australia the score for availability of finance data of political parties is 59.6 and the governance score is 70.4 ."
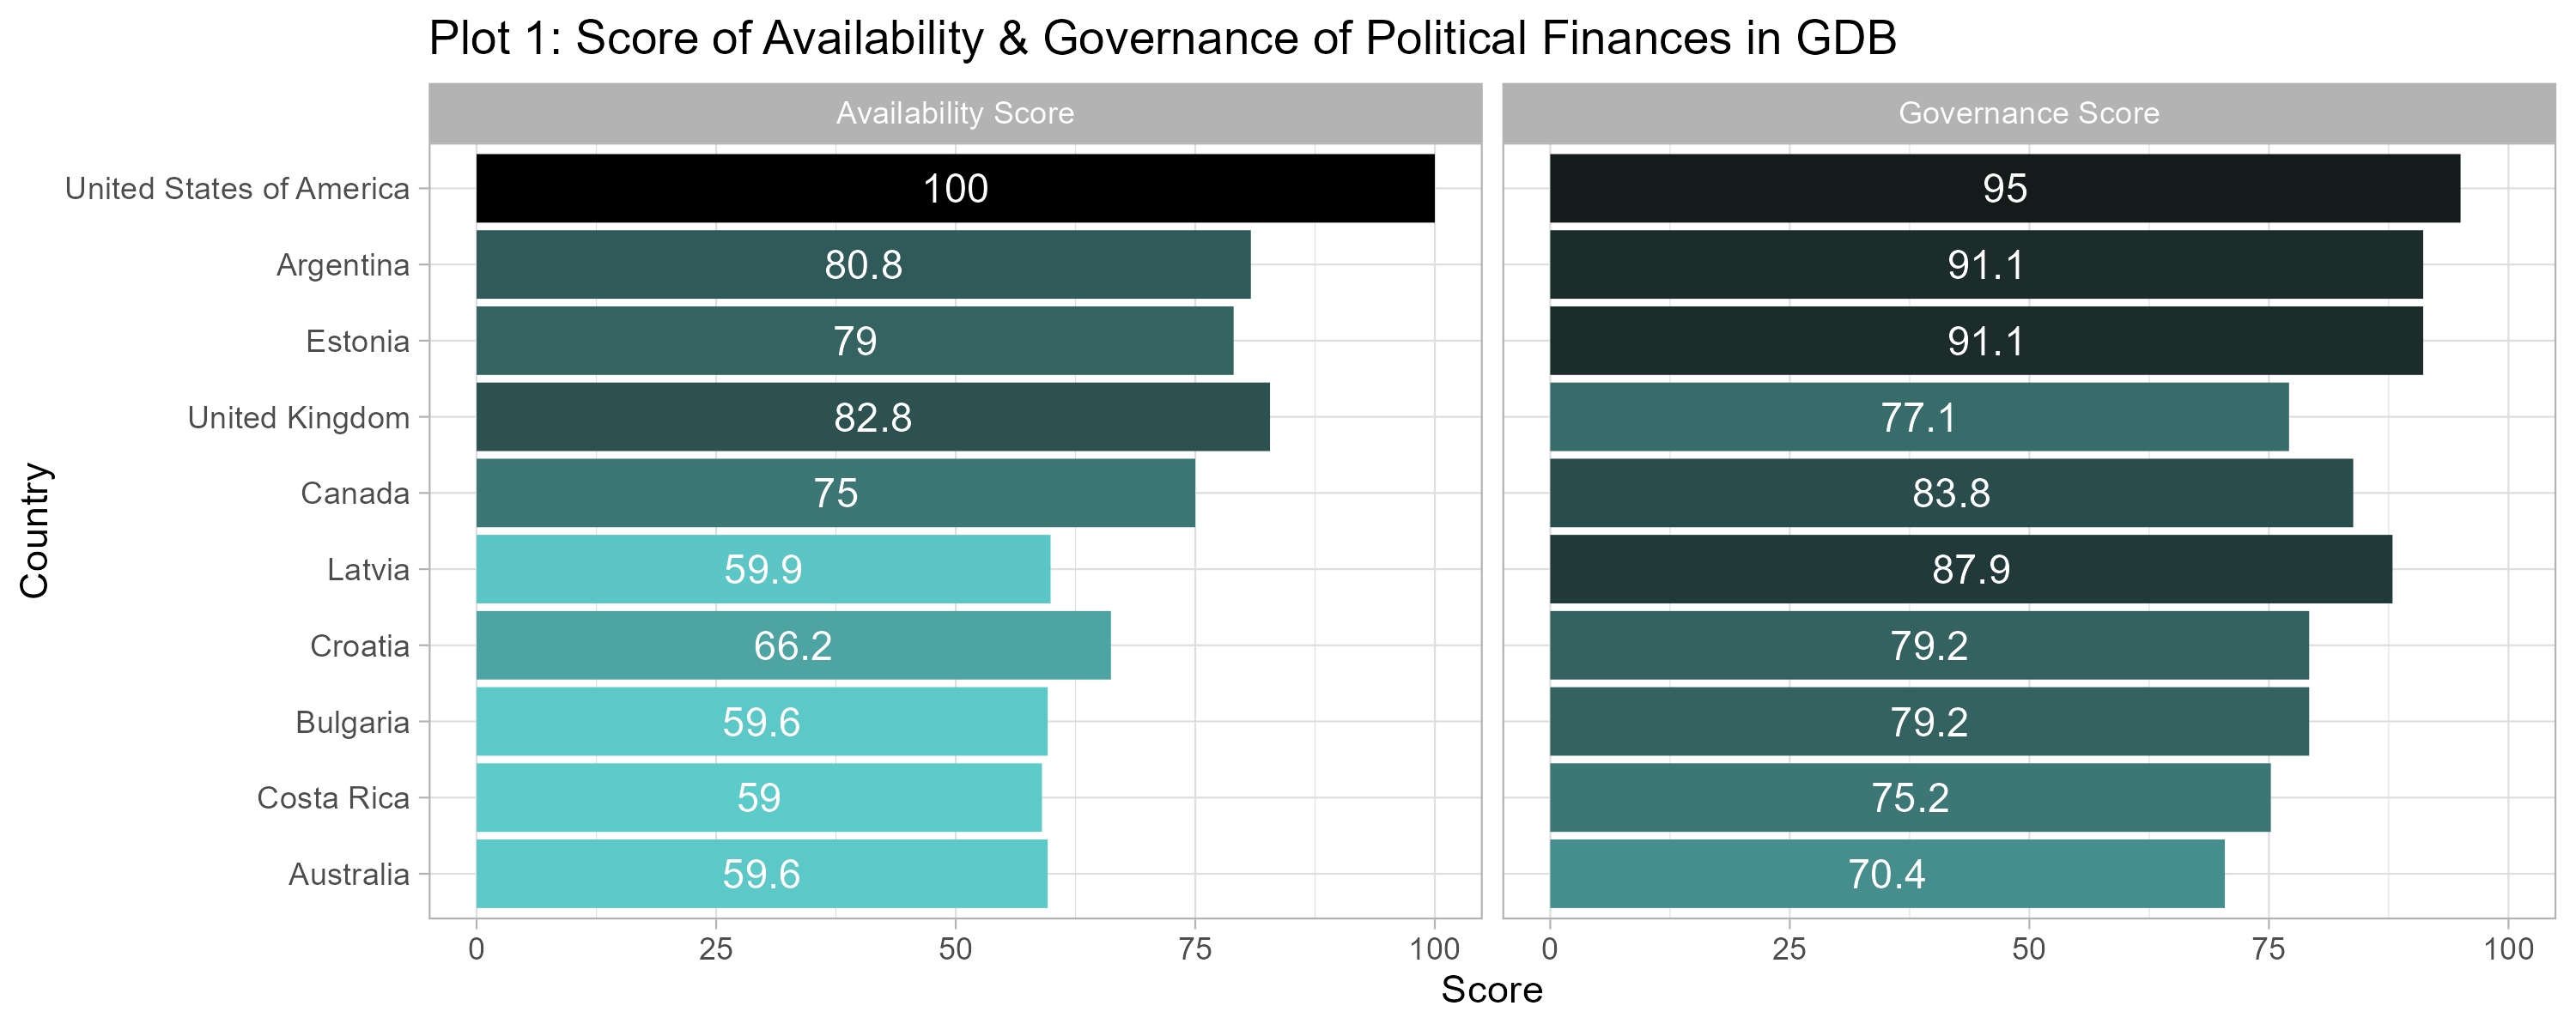
top_availability <- gdb_filter %>%

top_n(20, availability_score) %>%

select(country, availability_score)

top_governance <- gdb_filter %>%

top_n(20, governance_score) %>%

select(country, governance_score)

data_plot <- gdb_filter %>%

select(country) %>%

left_join(top_availability) %>%

left_join(top_governance) %>%

filter(!is.na(availability_score) & !is.na(governance_score)) %>%

gather('indicator', "score", availability_score:governance_score) %>%

mutate(indicator = ifelse(indicator=="availability_score", "Availability Score", "Governance Score"),

score = round(score,1))

data_plot$country <-ifelse(data_plot$country ==  "United Kingdom of Great Britain and Northern Ireland", "United Kingdom", data_plot$country)

ggplot(data_plot, aes(y=reorder(country, score), x=score, fill =score ))+
geom_bar(stat = "identity") +geom_text(aes(label = score), size = 3, position = position_stack(0.5), show.legend = FALSE, color = "white") +
theme_light()+
facet_wrap(~indicator) +
scale_fill_gradient(
low = "#5DCBCA",
high = "#000000",
aesthetics = "fill" ) +
theme(legend.position = "none") +
guides(fill=guide_legend(title="Score")) +
labs(x = "Score", y = "Country", title = "Plot 1: Score of Availability & Governance of Political Finances in GDB")
Mapping Transparency: Clusters of Political Finance Availability and Governance
But that’s not all. We’ll also be delving into other questions, such as which groups of countries share similar scores in our two main indicators (Availability and Governance). We will visualize this with a scatter plot, and then use the k-means unsupervised learning algorithm to group the countries together based on their scores (more information here). This algorithm will help us categorize countries into different groups, based on how closely they align with certain criteria. So, as we move along the scale, we’ll see which countries are doing better in terms of availability and governance of political finance data:
1) “LOW AVAILABILITY LOW GOVERNANCE”: In this category both the availability of political finance information as open data and the governance frameworks surrounding the collection and publication of such data are low. In these countries, there may be limited or zero access to information about campaign and party finance, and the legal and regulatory framework for transparency in this area may be weak or non-existence.
2) “LOW AVAILABILITY MEDIUM GOVERNANCE”: In this category, although the governance surrounding the collection and publication of political finance data may be somewhat stronger compared to the first category, the availability of such information as open data remains low. This suggests that while there may be some legal and regulatory provisions in place, they are not sufficient to ensure widespread accessibility to political finance information.
3) “MEDIUM AVAILABILITY MEDIUM GOVERNANCE”: Countries falling into this category have a moderate level of both governance and availability regarding political finance information. The legal and regulatory framework for collecting and publishing such data is relatively robust, and there is some degree of accessibility to political finance information as open data. However, there is still room for improvement in both areas.
4) “HIGH AVAILABILITY HIGH GOVERNANCE”: This category represents countries with strong governance mechanisms and high availability of political finance information as open data. These countries have comprehensive laws, regulations, policies, and guidance in place to facilitate the collection and publication of data on campaign and party finance. Additionally, political finance information is readily accessible to the public as open data, promoting transparency and accountability in this aspect of governance.
join_pf= gdb_filter %>%

select(country, governance_score, availability_score) %>%

filter(!is.na(governance_score))

join_pf = as.data.frame(join_pf)

row.names(join_pf) = join_pf$country

join_pf = subset(join_pf, select = -country)

set.seed(123)

km.res = kmeans(join_pf, 4, nstart = 25)

km.res$cluster = as.factor(km.res$cluster)

levels(km.res$cluster) = c("LOW AVAILABILITY LOW GOVERNANCE",

"MEDIUM AVAILABILITY MEDIUM GOVERNANCE",

"HIGH AVAILABILITY HIGH GOVERNANCE",

"LOW AVAILABILITY MEDIUM GOVERNANCE")

fviz_cluster(km.res, data = join_pf,

palette = c( "#6bfffd", "#5bc6c5", "#000000",  "#325e5d"),

ellipse.type = "euclid", # Concentration ellipse

addEllipses = FALSE, # No agregar elipses

star.plot = TRUE, # Add segments from centroids to items

repel = TRUE, # Avoid label overplotting (slow)

ggtheme = theme_light(),

main = "Plot 2: Public Finance Module's clusters") +

labs(y= "Availability", x ="Governance") +

theme(legend.position ="bottom")+

guides(color=guide_legend(ncol=2))
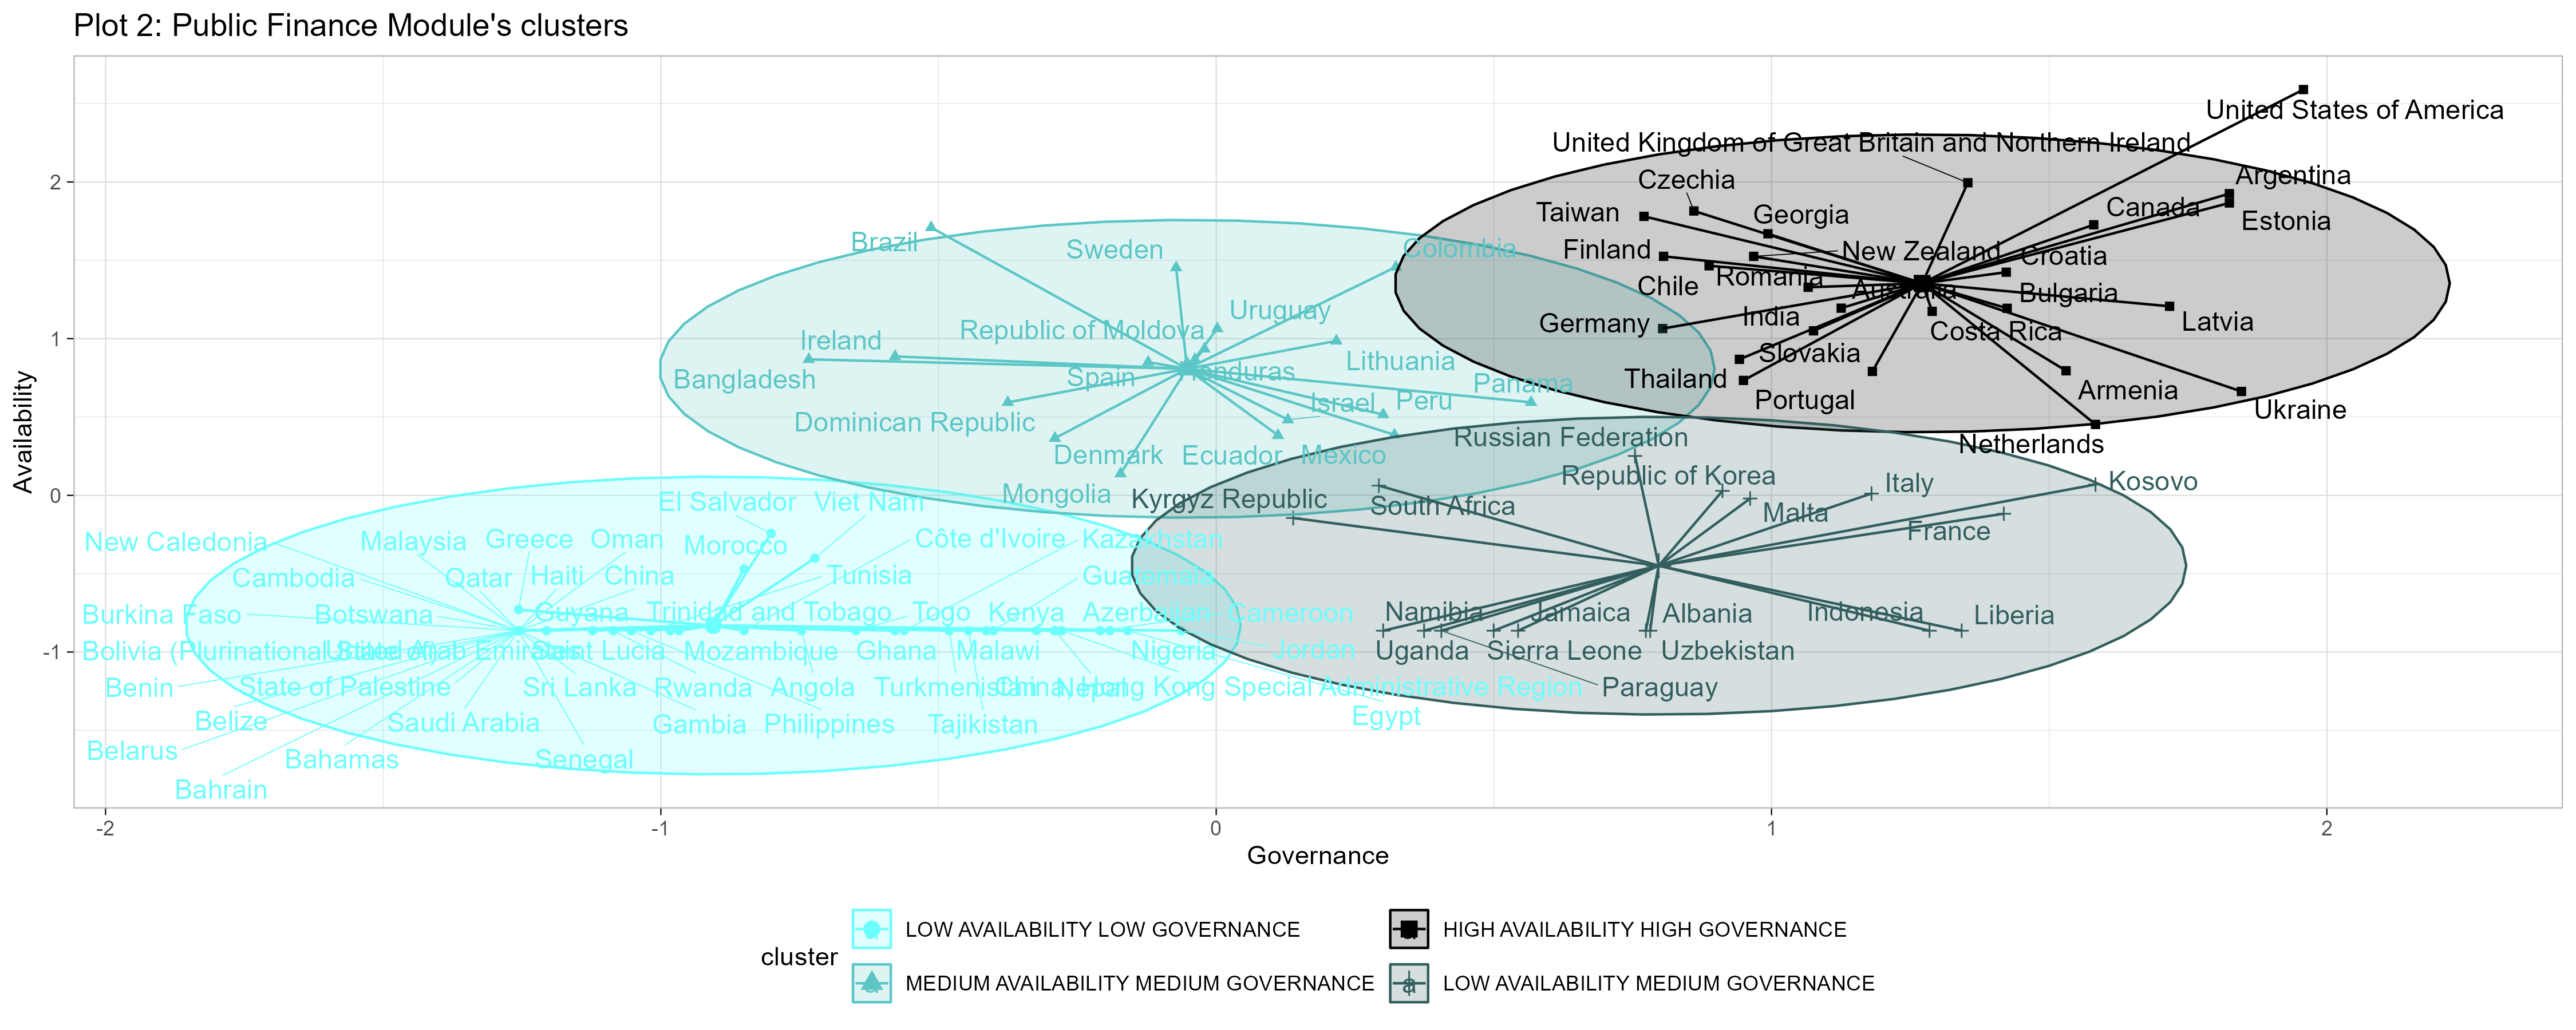
Also the Plot 2 shows, for example, that there are countries seemingly diverse—like Italy, Indonesia, Malta, South Africa, Paraguay, Jamaica, and Uzbekistan— that share a common thread of low data availability despite having adequate legislation regarding information transparency.
The data reveals a need for concerted efforts to bridge the gap between regulatory frameworks and implementation, ensuring transparency and accountability across political finance landscapes globally.
More information can be extracted in the table below, where we can measure exactly that 49 countries fall within the “LOW AVAILABILITY LOW GOVERNANCE” category, constituting 45% of our sample. Additionally, 25 countries (23%) fall into the “HIGH AVAILABILITY HIGH GOVERNANCE” cluster.
country_clusters = as.data.frame(km.res$cluster)

country_clusters$country= row.names(country_clusters)

names(country_clusters)[1] = "cluster"

names(country_clusters)[2] = "country"

flextable(country_clusters %>%

group_by(cluster) %>%

summarise(count = n(),

perc = paste0(round(count/109*100,1), " %")))
| cluster | count | perc | |
|---|---|---|---|
| LOW AVAILABILITY LOW GOVERNANCE | 49 | 45 % | |
| MEDIUM AVAILABILITY MEDIUM GOVERNANCE | 18 | 16.5 % | |
| HIGH AVAILABILITY HIGH GOVERNANCE | 25 | 22.9 % | |
| LOW AVAILABILITY MEDIUM GOVERNANCE | 17 | 15.6 % | |
join_pf$country = row.names(join_pf)

datos_combinados_country= join_pf %>%

left_join(country_clusters, by ="country") %>%

select(country,cluster,governance_score,availability_score)

map_worldwide = read_sf("https://storage.googleapis.com/gdb-files/posts/political-finance/map_worldwide.geojson")

country_clusters= country_clusters %>%

left_join(gdb_2021_full_dataset %>% select(country, iso3) %>% distinct(country, .keep_all = T)) %>%

distinct(country, .keep_all = T)

map_worldwide= map_worldwide %>%

left_join(country_clusters, by = "iso3")

map_worldwide$cluster = as.character(map_worldwide$cluster)

map_worldwide = map_worldwide %>% mutate(cluster =  ifelse(is.na(cluster), "Do not participate in GDB Survey", cluster ))

ggplot() +

geom_sf(data = map_worldwide, aes(fill = cluster), alpha = 0.6, color = "grey50") +

theme_light() +

ggtitle("Plot 3: Map of clusters of Political Finance situation per country") +

labs(fill = "Clusters")+

theme(legend.position = "bottom", legend.text = element_text(size=8)) +

scale_fill_manual(values = c(

"LOW AVAILABILITY MEDIUM GOVERNANCE" = "#5bc6c5",

"MEDIUM AVAILABILITY MEDIUM GOVERNANCE" = "#325e5d",

"HIGH AVAILABILITY HIGH GOVERNANCE" = "#000000",

"LOW AVAILABILITY LOW GOVERNANCE" = "#6bfffd",

"Do not participate in GDB Survey" = "#e1dddb"),

breaks=c('LOW AVAILABILITY LOW GOVERNANCE', 'LOW AVAILABILITY MEDIUM GOVERNANCE', 'MEDIUM AVAILABILITY MEDIUM GOVERNANCE',

'HIGH AVAILABILITY HIGH GOVERNANCE', 'NOT IN GDB SURVEY')) +

guides(fill=guide_legend(ncol=2)) 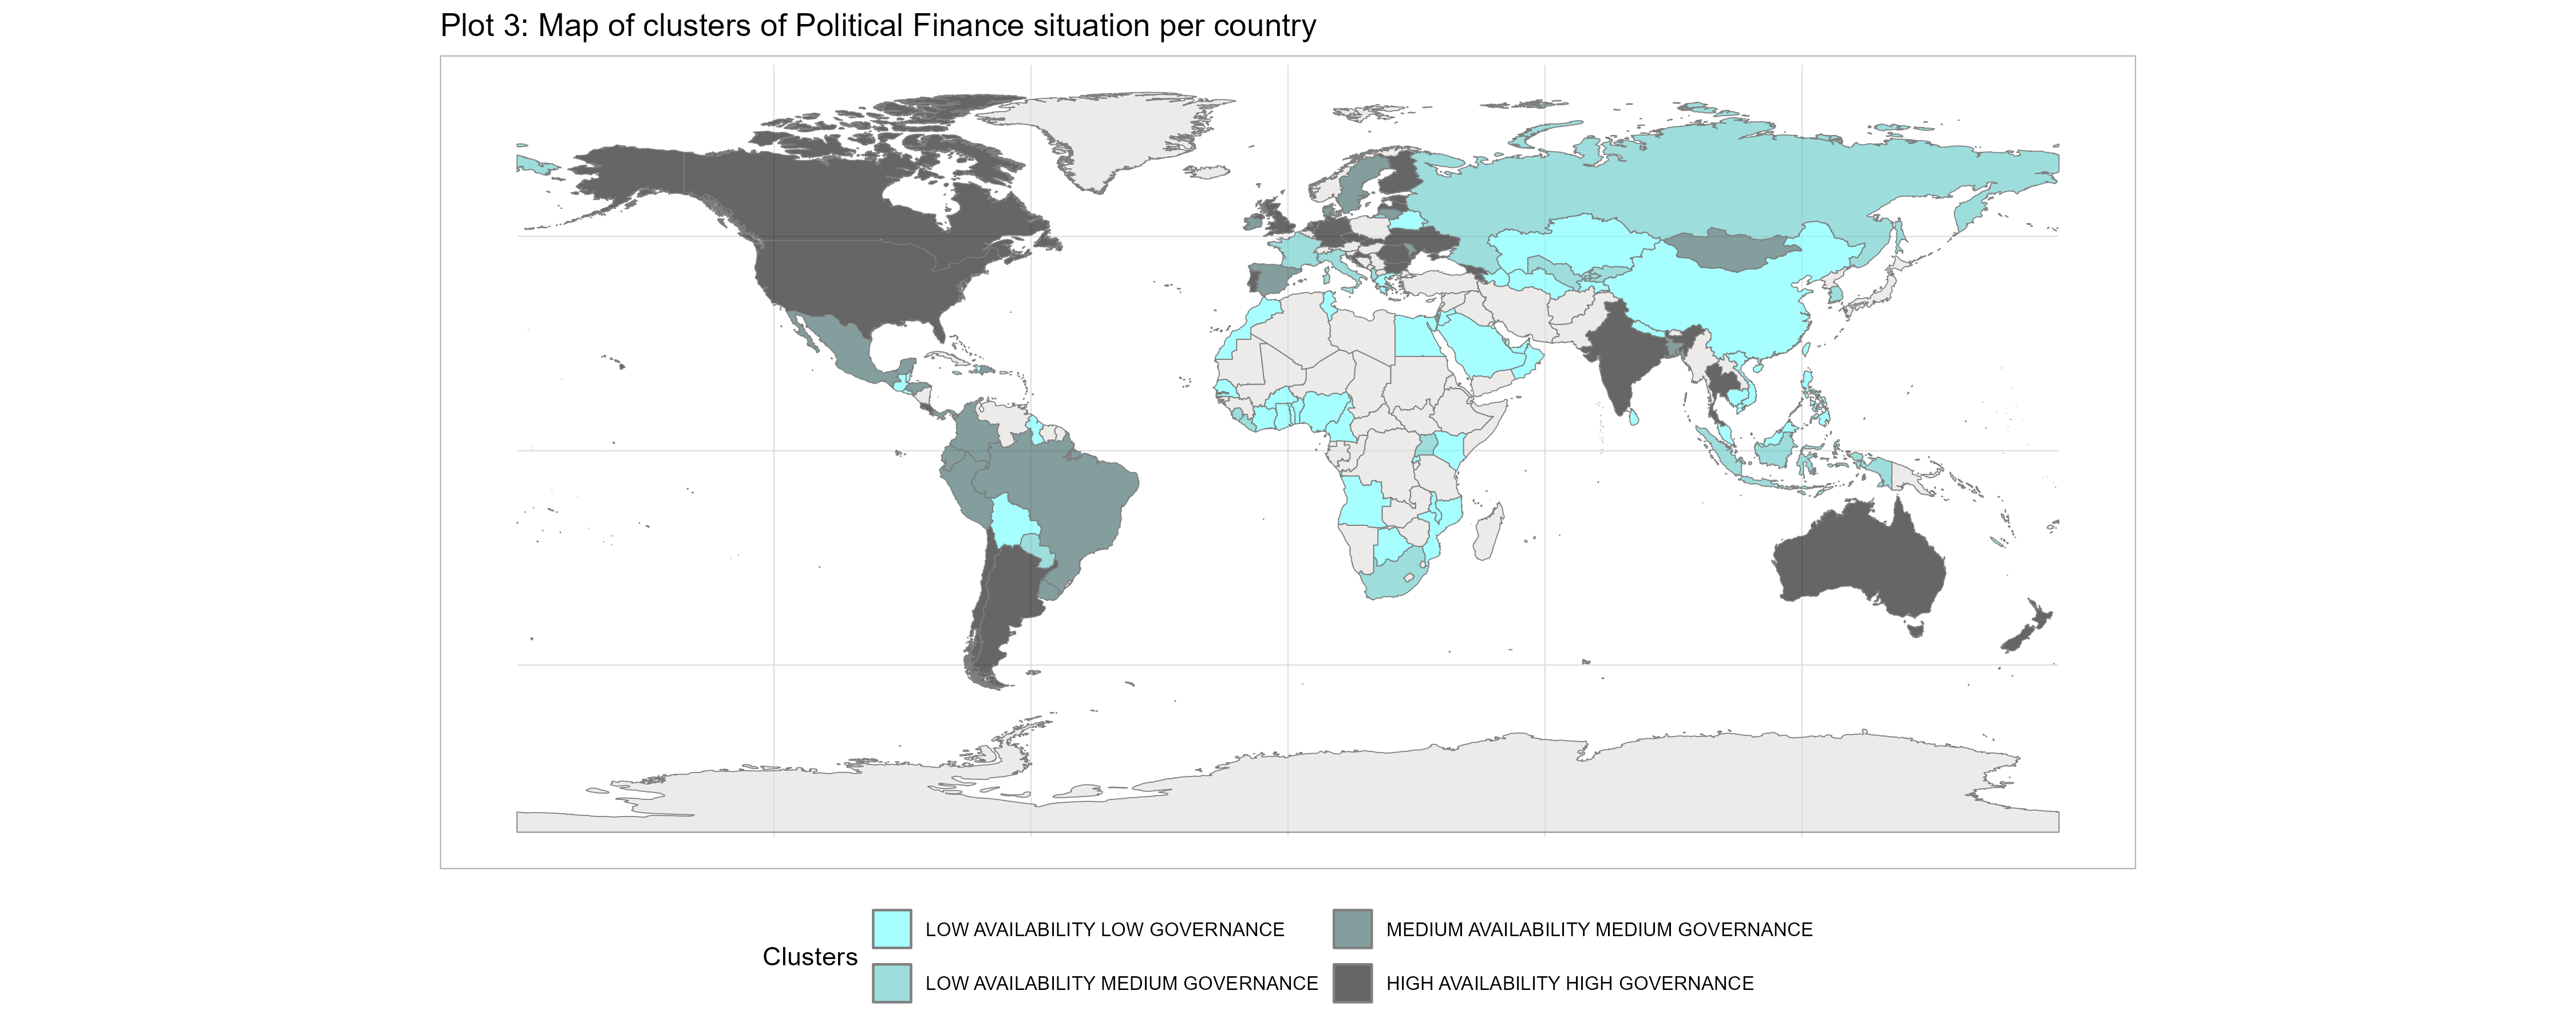
Summing up, the clustering of countries highlights significant gaps in the regulation of party finances. Most countries either lack transparency, providing insufficient information, or maintain minimal and inadequate regulations. This blogpost underscores the critical need to narrow this gap between regulatory frameworks and their practical implementation. Numerous countries face challenges due to limited data accessibility and poor governance.
Furthermore, this note emphasizes the importance of transparency and accountability in democratic processes. It argues that meaningful change is achievable through informed analysis and collaborative efforts, enhancing the potential for more effective governance.
Using R and the Global Data Barometer datasets, we can access valuable insights and address complex questions that other statistical tools might struggle with. Share with us your analysis in R on X (formerly Twitter) (@databarometer) or by email (feedback@globaldatabarometer.org).